


Cargando cotización


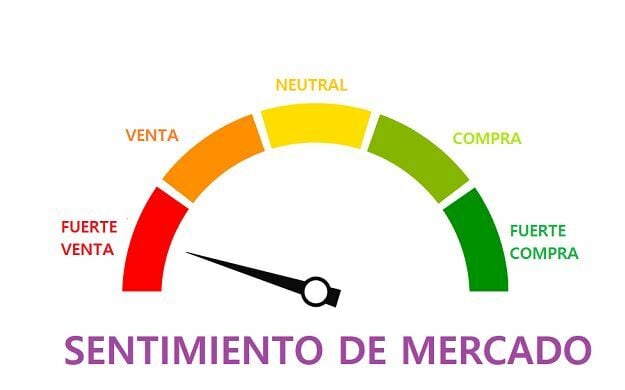
ENCUESTA SENTIMIENTO MERCADO
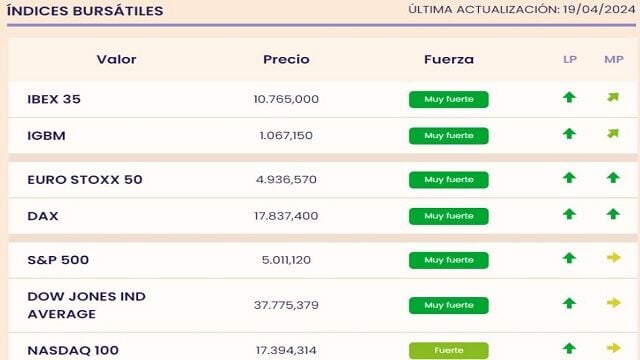
Un tercio del selectivo


El Ibex 35 salda la semana en positivo, sobre los 10.700 puntos, a pesar de los recortes por el conflicto entre Israel- Irán
¿Se acerca el momento de la verdad en las bolsas? Cerramos el seguimiento de la bolsa en directo Toast: Una tecnológica dedicada a los restaurantes a tener en cuenta a largo plazo Agenda macro del lunes 22 de abril El Ibex 35 salda la semana en positivo, sobre los 10.700 puntos, a pesar de los recortes por el conflicto entre Israel- Irán Los flujos de fondos se están volcando con las materias primas ¡Ojo al gráfico! Según Goldman, las dos primeras semanas de mayo son de lo peor del año históricamente Sunoco: Objetivo alcista tras activar una figura chartista de hombro cabeza hombro invertido Actualización de Cartera Tendencial de Acciones El comercio alemán con Irán se ha paralizado casi por completo en los últimos años


Actualidad
A repartir el 23 de mayo
Grupo San José aprueba un dividendo de 0,15 Euros por Acción
Los incrementa un 34,5%
American Express cierra el primer trimestre con sólido crecimiento de 2.400 millones de dólares
7,66 euros por acción
Dividendo de Aena de mayo: fechas confirmadas para que no se te escape el cupón
Israel-Irán
El S&P Global rebaja el rating de Israel en plena escalada de tensión
Rentabilidad superior al 6,4%

Los mejores dividendos del Ibex 35 en este momento
Operativa de trading

Trading: "Ojo al S&P 500 por debajo de 5.000 puntos con confirmación de mercado potencialmente bajista"
Por Audax
La transición verde en España pasa por las renovables
Por Sacyr
"La promoción de la transformación digital, con énfasis en la eficiencia, sostenibilidad y gestión de recursos, es una prioridad"

Talgo se reúne con más de 30 bancos para asegurarse la liquidez tras la OPA de Magyar Vagon
Consultorio fondos
 Miguel Ángel Cicuéndez - José Manuel García Rolán
Con una inflación elevada en qué fondos invertir
Miguel Ángel Cicuéndez.
Socio director
de Consulae EAF
José Manuel García Rolán. Socio de Consulae EAF
José Manuel García Rolán. Socio de Consulae EAF

1,59 euros brutos estimados por acción
Viscofan anuncia el dividendo flexible a sus accionistas para el 24 de junio
Restaurantes en la nube
Toast: Una tecnológica dedicada a los restaurantes a tener en cuenta a largo plazo

Gráficos de La Bolsa HoyVer más
Los flujos de fondos se están volcando con las materias primas

¡Ojo al gráfico! Según Goldman, las dos primeras semanas de mayo son de lo peor del año históricamente

Sunoco: Objetivo alcista tras activar una figura chartista de hombro cabeza hombro invertido

El comercio alemán con Irán se ha paralizado casi por completo en los últimos años

Gas Natural: vigilamos la ruptura de un rango lateral

Las opciones sobre el petróleo están disparadísimas

No se asusten, los gestores de fondos están muy optimistas con las acciones

Enagás: vigilamos la ruptura de un rango lateral

El Yen nunca estuvo tan bajo con respecto al Yuan chino

La confianza del consumidor en España se eleva hasta el 82,5 en marzo desde el 78,5 del mes anterior

Desde noviembre el sentimiento de mercado no era tan negativo

Los toros del mercado que han sido los protagonistas, empiezan a no ver el sol

La huida hacia la seguridad tras el ataque de Israel a Irán provocó que el bono a 30 años subiera un 1,15%, aunque parte de las ganancias ya se han recuperado

El déficit comercial de España se redujo ligeramente a 2.400 millones de euros en febrero, frente a los 2.500 millones del mismo mes del año pasado

El comercio minorista en Reino Unido no muestra variación en marzo con respecto al mes anterior

Los precios producción Alemania suben un 0,2% en marzo

El oro es más rentable que el S&P 500 a 5 y a 1 años en el ciclo actual

El índice de la Fed de Filadelfia sube a 15,5 en abril

El diferencial entre el rendimiento de los beneficios del S&P 500 y el rendimiento del Tesoro a 10 años ha seguido bajando este año y se sitúa cerca de su nivel más bajo desde 2002

La rentabilidad del Tesoro estadounidense a 10 años vuelve a acercarse peligrosamente al 5%


En sustitución de Juan Bernal
Ana Martín Santa Olalla, nueva directora general de la gestora de Caixabank


Marcas y mercados
Estrategias de Inversíon
¿Se acerca el momento de la verdad en las bolsas?

Webinario Gratuito
Dónde están las acciones y sectores más fuertes del mercado


Activos en Vigilancia


Con José María Álvarez-Pallete
Telefónica toca campana en la Bolsa de Madrid por la celebración de su centenario
Vencimiento en 2029
Colonial coloca 200 millones en bonos para refinanciar parte de su deuda
Life Settlement
 José García
Seguros de vida en bolsa, una de las mejores opciones de inversión: "mercado estable y descorrelacionado"
José García.
Chief Executive Officer
de Carlisle Management Company
- "¿Por qué le interesa un inversor comprar Life Settlements? Porque es un mercado muy estable y su rendimiento no está correlacionado con los mercados financieros"
- "Cuando compras un seguro de vida, retienes el beneficio hasta que haya una muerte, por lo que la liquidez sería un riesgo secundario"
- "Los inversores no deberían excluir de sus carteras a los productos alternativos, sobre todo en un momento de incertidumbre política y económica con el actual"
Oportunidades de inversión

Análisis del Ibex


Marcas y mercados
Estrategias de Inversión
Cazadores de Tendencias en Bolsa. Libro gratuito para suscriptores

Estrategias de Inversión
Estas son las verdaderas joyas de BME Growth: Casos de éxito


Impacto a largo plazo


Para salir a Bolsa
 Jesús González - Nieto
"Estamos trabajando en varios expedientes para salir a bolsa en el BME Scaleup y en BME Growth"
Jesús González - Nieto.
Director gerente
de BME Growth
MERCADO INMOBILIARIO
Sector inmobiliario
La rentabilidad del 'ladrillo': pros y contras de invertir tu dinero en viviendas y garajes
JGA 2024: Cuentas 2023, dividendo...
Grupo Insur incrementa un 1,6% la cifra de negocio y un 35,6% el EBITDA en 2023
Gracias a su estrategia de dinamización
Los centros comerciales de SILICIUS mejoran un 8,4% su facturación en 2023 y superan los 75 millones de euros
SANIDAD
La consulta aporta asesoramiento personalizado, un calendario de vacunación individualizado, en caso de ser necesario, y pautas de profilaxis y tratamiento
La Fundación Jiménez Díaz pone en marcha el Servicio de Atención Integral al Viajero Internacional para ofrecer información y cuidado integral y especializado de la salud antes, durante y después del viaje
Primera causa de muerte en la mujer
Los programas de neurorrehabilitación permiten mantener un alto grado de funcionalidad tras un ictus
La investigación se ha publicado en la revista científica British Journal of Pharmacology
Un estudio liderado por el CSIC con participación del IIS-FJD halla una combinación de fármacos eficaz frente al SARS-CoV-2
Últimos vídeos de Ei


Encuentros digitales

BOLSA Y MERCADOS FINANCIEROS
analista independiente en
solo se responderán preguntas sobre acciones y una consulta por usuario)

FONDOS DE INVERSIÓN
Asesor Financiero en SLM & Director en
ISEFI
Solo se responderá a una pregunta por usuario)

FONDOS DE INVERSIÓN
socio en
Consulae EAF
solo se responderán preguntas sobre fondos y una consulta por usuario)

COMMODITIES
¿PODRÍAN ALCANZARSE NUEVOS MÁXIMOS?
A medida que se acerca el halving, la oferta de Bitcoin sigue siendo escasa
WISDOMTREE OPINA
¿Cuánto debería invertir un inversor neutral en criptomonedas?
SEGÚN WISDOMTREE
Cómo la IA generativa está cambiando el panorama de la ciberseguridad
BME GROWTH, EMPRESAS EN CRECIMIENTO
Acuerdos estratégicos
Izertis, primer partner mundial de Rasa, principal plataforma abierta de IA conversacional generativa
Oportunidades de inversión
Estas son las verdaderas joyas de BME Growth: Casos de éxito
Por Arteche
Todos los caminos llevan a la transición energética
Cursos destacados
Análisis Técnico para invertir en Bolsa

Estrategias trading para 2024

¿Dónde está la fuerza de mercado? Sectores y acciones líderes
GRABACIÓN DE SEMINARIOS ANTERIORES
SACAR TU EMPRESA A BOLSA
Oportunidades de inversión
BME Growth: salto al crecimiento de la empresa familiar
Financiación y adquisiciones
Cotizar en Bolsa consolida a las pymes. Casos de éxito
Para salir al mercado
“BME Growth está mucho más cerca de las pymes de lo que se cree”
X